(This story by Dave Lindorff was published initially in FAIR.org)
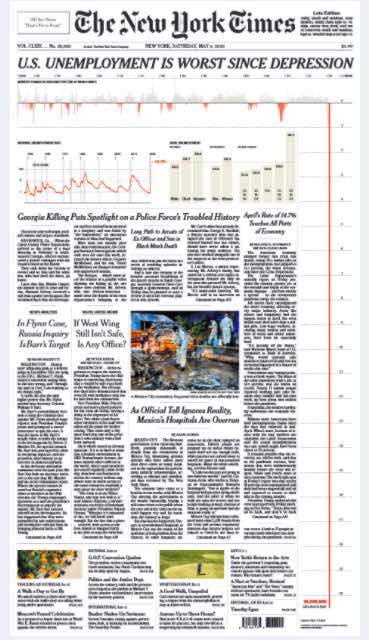
The Bureau of Labor Statistics’ eagerly awaited Friday morning Official Unemployment Rate report for April—what editors generally call the BLS’s “headline” rate of unemployment —was definitely headline-worthy. This was especially evident in the next day’s New York Times (5/9/20), which ran a bar chart of historic unemployment going back to 1946 across the top of the front page, and then a long red bar down the right-hand column of the entire page showing job losses for April.
It was a dramatic illustration of how the bottom had fallen out of the job market, with 20.5 million new jobless workers bringing the unemployment rate to 14.7% — the highest that number has been since the end of the 1930s.
But the blaring headlines should actually have been considerably worse (perhaps with that red bar running off the bottom of the Times front page).
Ignored by nearly all US news organizations, at least initially, was an explanation made by the BLS at the end of its press release on the April layoffs, explaining that the official U-3 unemployment rate, which is supposed to measure jobless people actively looking for work, was actually incorrect. In a boxed 572-word addendum appended to its press release (and referenced in a note at the top of the release) was the following explanation:
There was also a large increase in the number of workers who were classified as employed but absent from work. As was the case in March, special instructions sent to the household survey interviewers called for all employed persons absent from work due to coronavirus-related business closures to be classified as unemployed on temporary layoff. However, it is apparent that not all such workers were so classified.
If the workers who were recorded as employed but absent from work due to “other reasons” (over and above the number absent for other reasons in a typical April) had been classified as unemployed on temporary layoff, the overall unemployment rate would have been almost 5 percentage points higher than reported (on a not-seasonally adjusted basis). However, according to usual practice, the data from the household survey are accepted as recorded. To maintain data integrity, no ad hoc actions are taken to reclassify survey responses.
There’s a lot of gobbledygook in there, but the upshot is that if reporters and news editors had read the note, they should have reported the BLS “headline” unemployment rate as 19.7%, not 14.7%. As the BLS wrote in its note, if the error in classifying some laid off workers in the survey had been corrected the rate would have been the higher figure.
That correction puts the real U-3 number in the range of unemployment rates that were being reported during the mid-1930s, in the depths of the Great Depression…
For the rest of this article by DAVE LINDORFF in FAIR.org, the media monitoring website of Fairness and Accuracy in Reporting, please go to: https://fair.org/home/us-jobless-rate-broke-depression-era-record-but-most-media-missed-it/
