The White House, and most headline writers around the country, are crowing that the November jobless rate of 7.0%, reported Friday by the Bureau of Labor Statistics, is the lowest since 2009 when President Obama took office, when it was 7.3% and rising.
But is this number really something worth cheering?
Not if you look behind it.
That 7.0% number is the BLS’s so-called U3 figure, which is the percentage of the labor force currently unemployed, and it is significantly lower than the figure for November 2012, which was 7.8%. But U3, known as the “official unemployment rate,” doesn’t really count everyone who is unemployed. It doesn’t include, for example, anyone who has even one hour a week of work, or who has not had a job for more than six months, or who in despair has given up looking.
A better number to look at, in terms of getting a true picture of the health of society and the economy, is the BLS’s U6 number, which also counts as unemployed those who are “marginally attached to the labor force,” meaning discouraged people who are not working and have given up looking for work, but who told BLS interviewers that they have looked within the past year and would take a job if one were available. U6 also counts as unemployed those who are currently working part-time for “economic reasons,” meaning that they want full-time work but cannot find it.
The U6 measure of unemployment for November is 13.2%, and while that too is down from 14.4% in November 2012, it is historically very high. Furthermore, as the analytical website ShadowStats points out, even U6 doesn’t tell the whole story. The BLS U6 figure, as ShadowStats’ John Williams notes, doesn’t count long-term discouraged workers — people who have given up trying to find work because they cannot find a job. This group was “defined out of existence” by the BLS during the Clinton presidency in 1994. You can understand why that was done: adding these people to the total gives a current unemployment rate of a whopping 23% — a number that, unlike the U3 and even U6, has been continuing to rise since the start of the so-called Great Recession in late 2008, even through the last four years of “economic recovery.”
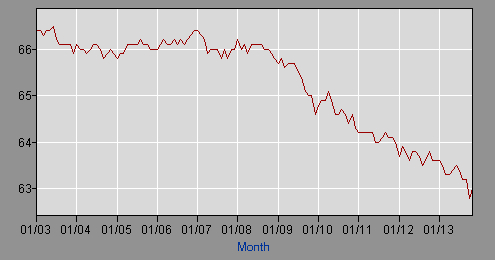
 As this ShadowStats graph demonstrates, the crucial labor participation rate has been falling since at least 2003 (click on image to go to ShadowStats.com)
Where those missing workers still show up in the BLS statistics is in a figure called the “labor participation rate,” which is the percentage of working-age people over the age of 16 who are working. This rate has been steadily falling since December, 2007, when a record 66.0% of the labor force had jobs. The percentage fell to 64% in 2011 and 63.6% in 2012, and in November of this year hit 63% — it’s lowest figure to date. Just between July and November — a four-month period — the labor force gained 455,000 people according to the BLS and the US Census bureau. Yet the report says only a net 203,000 jobs were added. In other words, while 203,000 unemployed people found jobs, there were another 252,000 people who joined the work force — high-school or college students who gradated, cashiered troops, young people reaching working age or people who had given up looking for work who started actively looking for jobs again, for example–who could not find work.
The other thing not widely reported in the corporate media, which tend to cheerlead every rise in the BLS’s U3 number, is that a job gain of 203,000 is not much to crow about. At that rate, if it were to continue out into the future uninterrupted, it would take about seven more years to get back just to a jobless rate of 6%, which is where the U3 figure was in June 2009. (Economists claim that so-called “full employment,” where everyone who wants a job can find one, would require a U3 unemployment rate of 5% or lower). And nobody expects this economy to keep going even at its current anemic pace for that long without another downturn.
Meanwhile, according to the BLS’s stats, there are nearly 11 million Americans looking for work who cannot find it, and another 10 million working part-time only because they cannot find full-time work.
This helps explain why despite nearly four and a half years of what is officially being called a “recovery” since June 2009, the median wage in the US, in inflation-adjusted dollars, remains nearly $1000 lower than it was way back in 1998, some 15 years ago.
What exactly then is the White House boasting about?
And how are Americans supposed to intelligently discuss national politics if they aren’t given these real facts about what it happening in the economy?
Oh yeah, that’s why the White House, Democrats in Congress, and the corporate media are all cheering the November U3 number.
